How to use pdb to debug Python Burp Extensions
Burp Extender
Burp Suite Pro is a great tool for penetration testing web applications. The app is written in Java and it includes a feature called “Extender” that supplies an API for developing Java-based extensions for the tool. Extender also allows for development of tools in Python, via Jython. As with any coding effort of reasonable complexity, developing extensions without a debugger can be painful.
Burp Extender
This post describes how to use pdb, the de-facto Python debugger, to debug Burp extensions written in Python. The technique is pretty basic and seems kind of obvious now that I’ve figured it out, but my quick google searches didn’t turn up any explanations elsewhere so I decided to quickly summarize and share how to do it.
Assumptions
I’ll assume that readers are familiar with (and give damn about) how to develop Python-based Burp Extensions. For the unfamiliar, check out the example extensions from PortSwigger to get started.
Debugging with pdb
The steps below describe how to get up and running with pdb.
1. Connect sys.stdout and sys.stderr to Burp
Somewhere in your extension’s initialization code, connect your Python instance’s sys.stdout and sys.stderr to Burp’s stdout and stderr streams via the Burp callbacks getStdout and getStderr. I do this right in the registerCallbacks method of my BurpExtender class – the initialization entry point for all Burp Extensions.
class BurpExtender(IBurpExtender):
    def registerExtenderCallbacks(self, callbacks):
        import sys
        sys.stdout = callbacks.getStdout()
        sys.stderr = callbacks.getStderr()
        ...
2. Drop a pdb trace in your code
Next, pick a location in your code that you’d like to debug. Right now I’m debugging some code that logs Burp Repeater activity, so I’ll use that as an example:
def add_repeater_entry(self, entry):
    import pdb; pdb.set_trace()

    # Make directory for this entry

    host_dir = os.path.join(self.repo_path, entry.host)
    if not os.path.exists(host_dir):
        os.mkdir(host_dir)
    ...
Those are the only changes you have to make to your extension code – pretty simple.
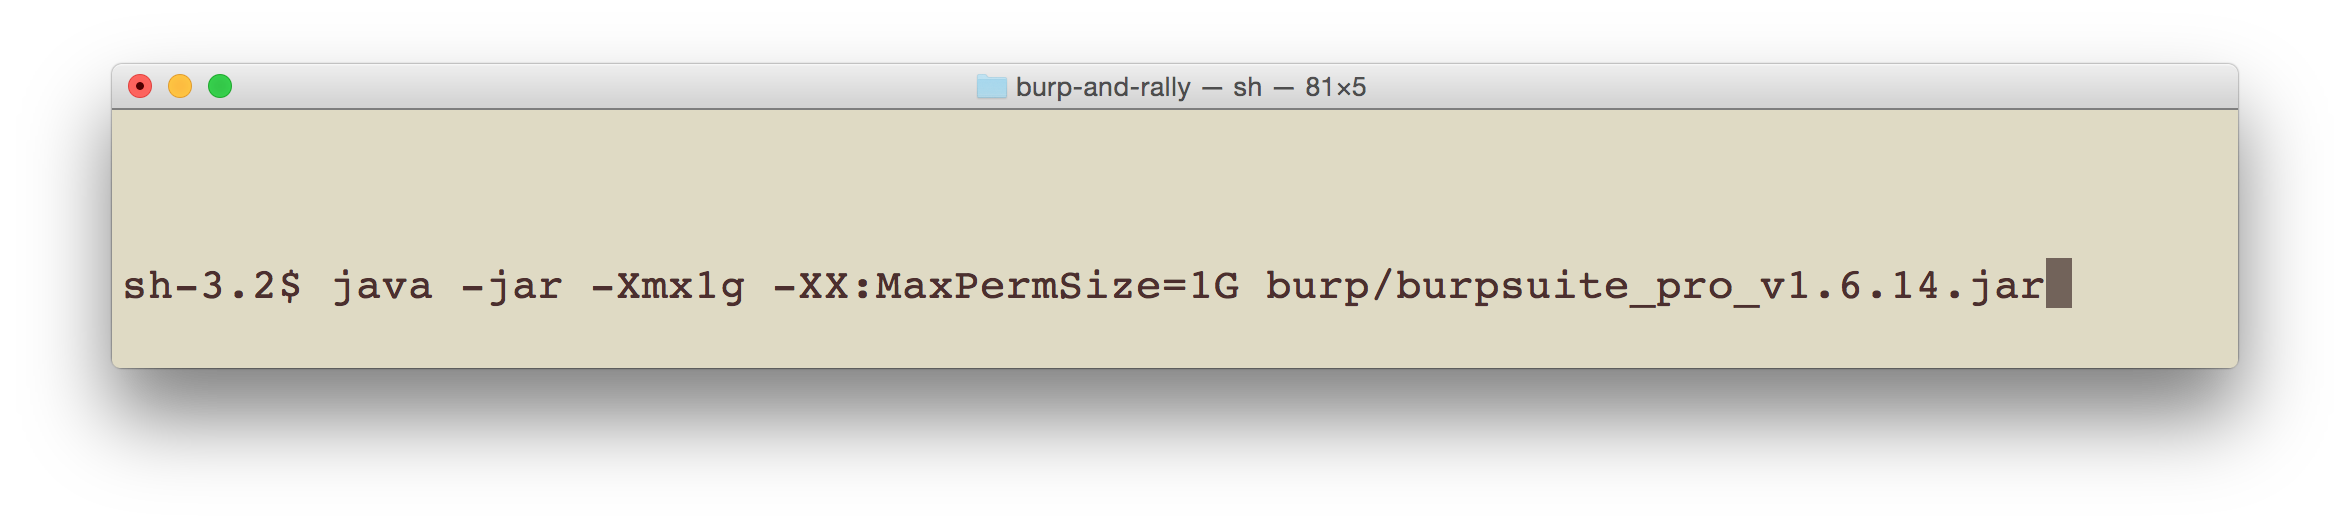
3. Run Burp Suite from an interactive shell and load your plugin
Next, you’ll want to run Burp Suite from an interactive shell. This will be the shell that you use to interact with pdb.
Once the Burp UI is ready, load your plugin as usual. Almost done.
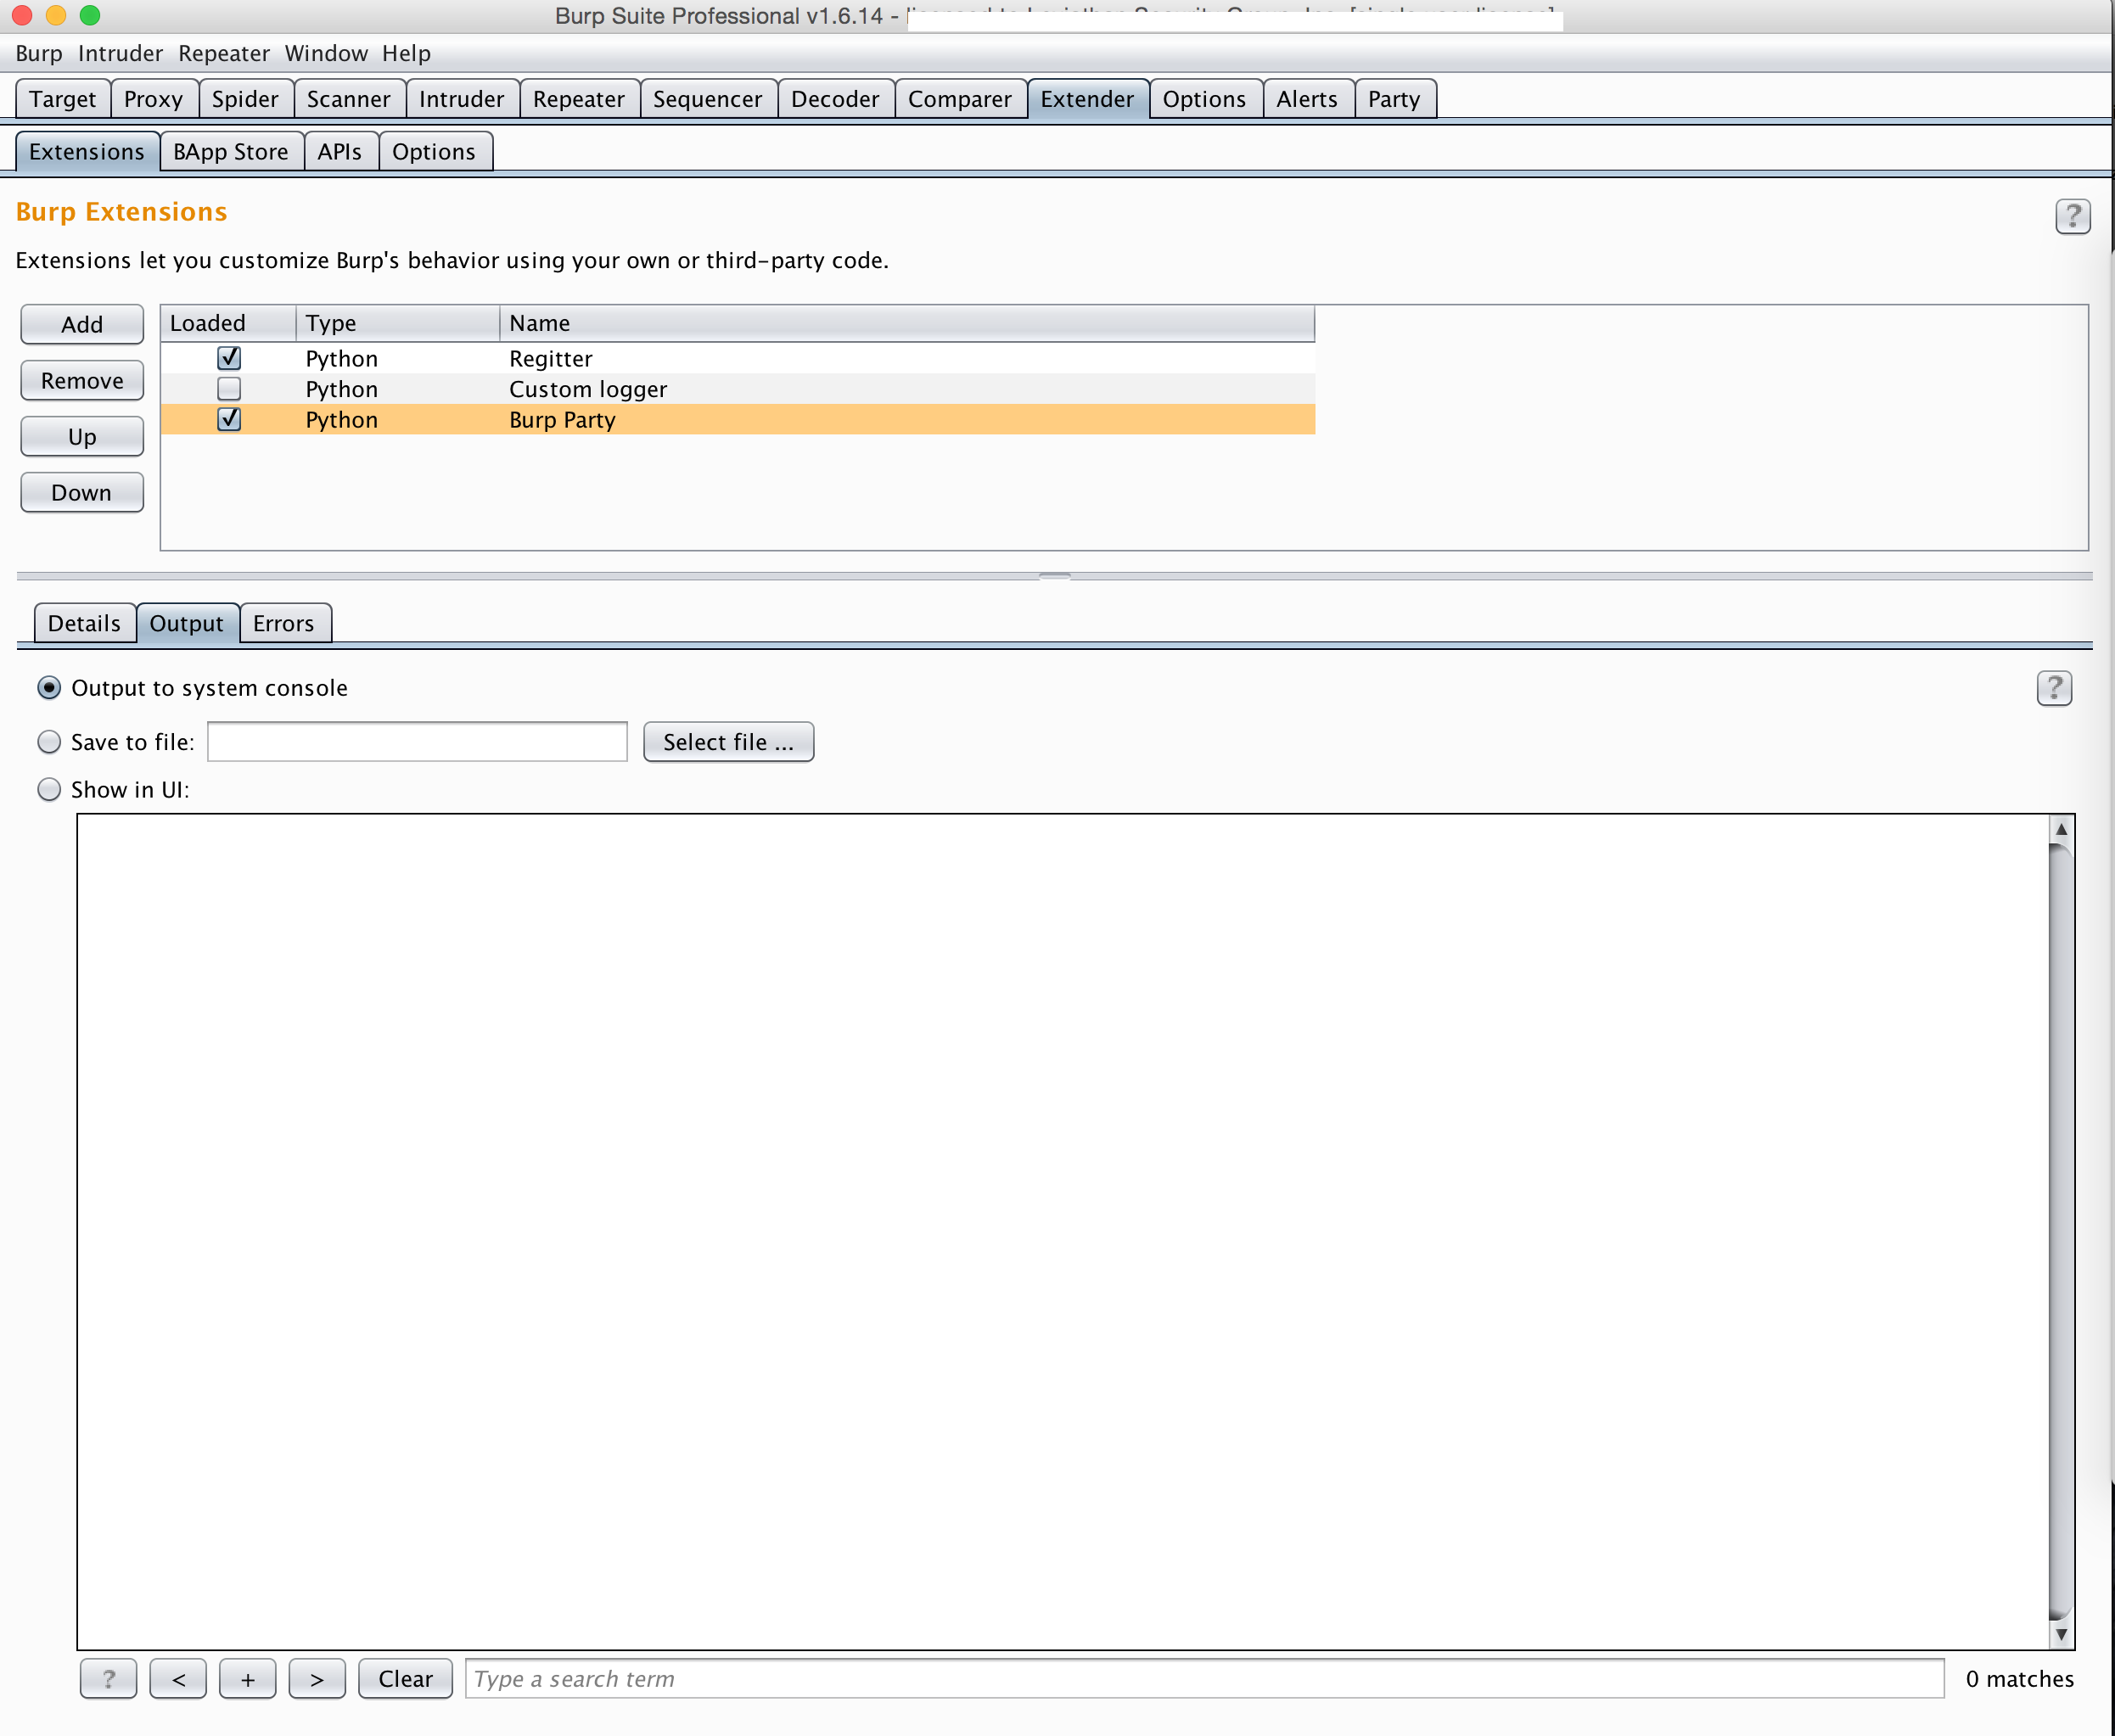
4. Direct “Output” and “Errors” to the system console
The last step is to tell Burp to direct its stdout and stderr to the console that you used to launch Burp
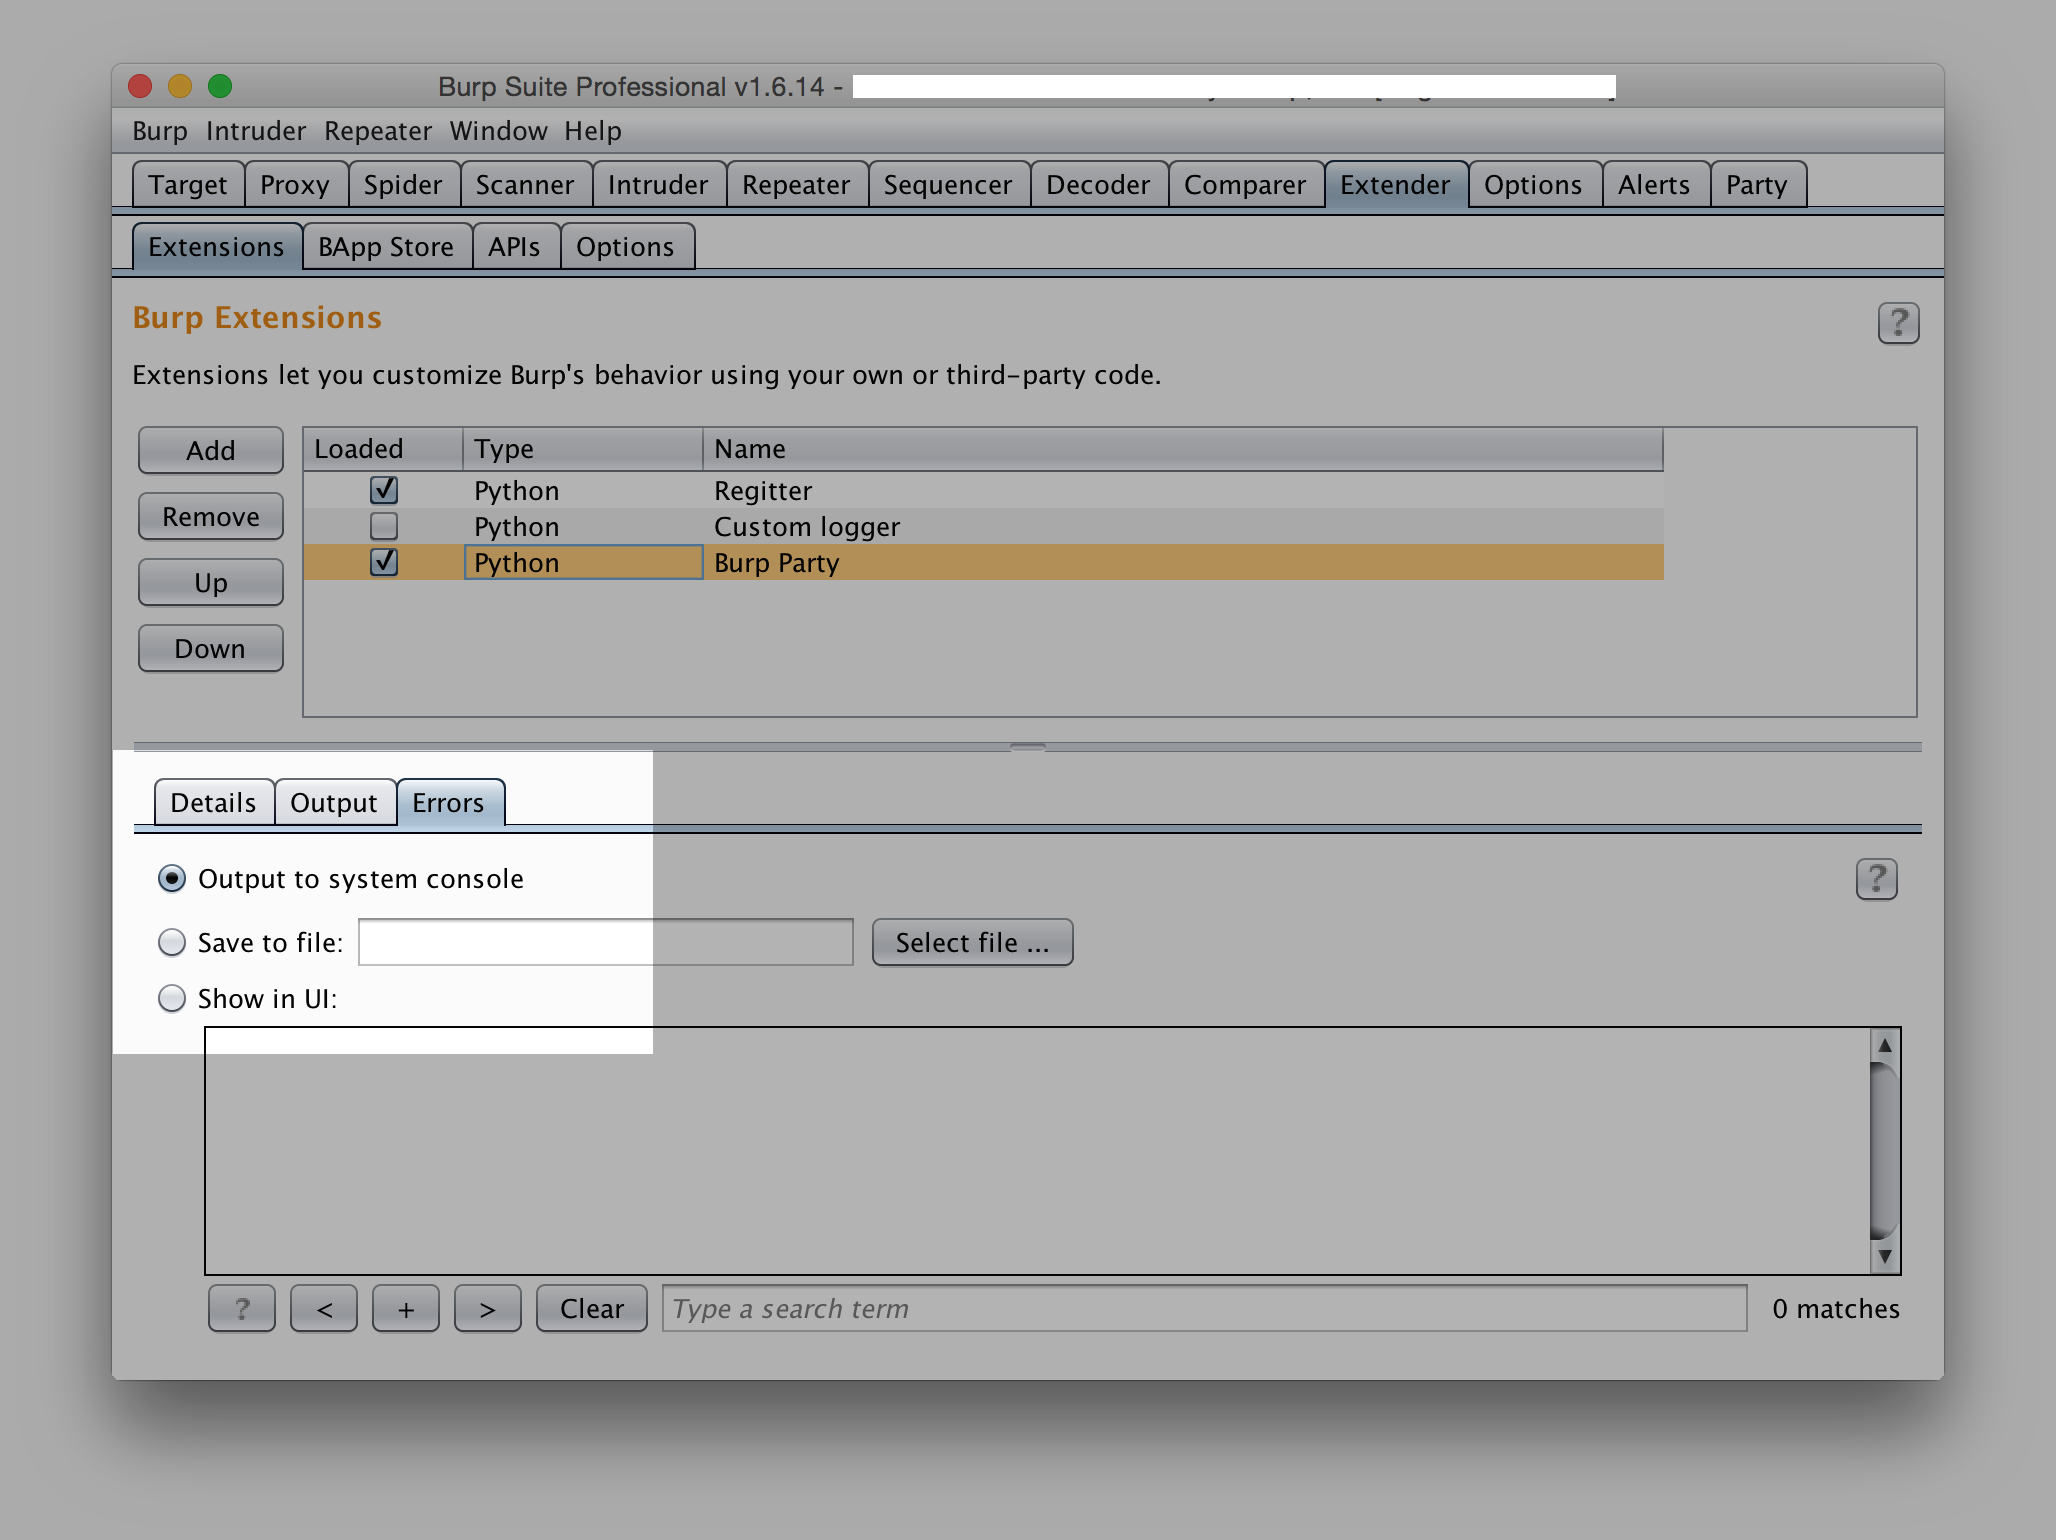
You’ll definitely want to direct stderr to the console, and you’ll probably want stdout there too for any debug print statements or other context clues.
5. Trigger the trace and pdb your face off
The final step is to trigger your trace (if you haven’t already done this inadvertently ;) and start debugging.
$ java -jar -Xmx1g -XX:MaxPermSize=1G burp/burpsuite_pro_v1.6.14.jar
> burp/modules/burp_and_rally.py(202)add_repeater_entry()
host_dir = os.path.join(self.repo_path, entry.host)
(Pdb) l
198             import pdb; pdb.set_trace()
199
200             # Make directory for this entry
201
202          host_dir = os.path.join(self.repo_path, entry.host)
203             if not os.path.exists(host_dir):
204                 os.mkdir(host_dir)
Conclusion
That’s it – short and sweet. Happy Burping.